Making Open Data Machine-Usable
Open data is data (like statistical and scientific data) that is free to use by anyone. During the COVID-19 pandemic, new data is coming from all directions on a daily basis.
One important aspect of open data is making sure that it can be used by computers. Computers make it much easier to collect and analyze data in order to find trends and make predictions, which is crucial in responding to a crisis.
It’s not enough for data to be available in a digital format. A PDF report with a table containing the latest case numbers is technically data that a computer can use (you can read it on a computer), but writing a program to extract the numbers from the table is tedious and prone to mistakes. Maybe you could try to copy and paste the numbers into a spreadsheet. That might be faster and easier, but it’s still a bit tedious and still prone to mistakes.
Computers can only do what people tell them to do, so making data usable is ultimately about making sure that people, the programmers and scientists that are interested in the data, can use it. This goes beyond just having a computer read it, which is why I use the term “machine-usable” instead of “machine-readable.”
If you’re publishing open data, here are some tips for making your data machine-usable.
1. Use a Simple Data Format
Simpler is better, because simpler means fewer things to account for and fewer places to make mistakes. JSON and CSV are simple and widely used formats which should be your go-tos for machine-usable data.
PDF is an incredibly complex format that includes features for text formatting, page layout, graphics, and much more. Its technical specification is about a thousand pages long. In contrast, JSON is a simple format that includes basic features for structuring data. It can be described in a single Web page. CSV is an even simpler format for tabular data that can be described in a few basic rules.
As a format gets more complex, programs (and people) have more features to account for, and some of those features can get lost in that complexity. Excel spreadsheets, for example, are extremely complex and require a complex program to use them. People can forget things like the fact that Excel insists on turning anything that resembles a date into a date, which leads to people being confused about how airport runways are named and geneticists being forced to rename human genes. If that data had been provided using CSV, people could use it without being beholden to Excel and its idiosyncrasies.
2. Document the Data Fields
Even if you’re using a well-known format, you still need to describe what each part of your data actually means.
The documentation should be able to answer questions like:
- How is the data organized? (What do the CSV columns mean? What keys are in each JSON object?)
- For numerical values, what units are they using? (Is the weight in pounds or kilograms? Is the number of people in individuals or thousands?)
- For categorical values, what are the different categories and how exactly are they written? (Do the age groups include 18 to 30 or 18 to 35? Are they written like “18 to 30” or “18–30”?)
3. Be Consistent
The data should be consistent with both the data format you’ve decided to use as well as your documentation.
Consistency with the data format means using it properly. It’s possible to get even the simplest formats wrong. For example, you might think that CSV is just a matter of sticking commas between values, and you’d be right…until a value has a comma in it.
Consistency with the documentation means following the rules you’ve set. If the documentation says the weight is in kilograms, don’t give it in pounds. If the documentation says that the age groups include “18 and under,” don’t give an age group as “18 and below.”
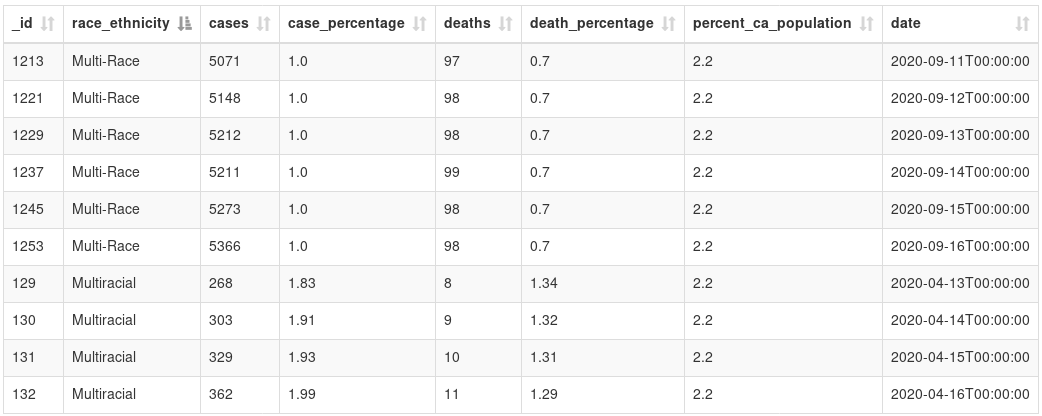
For example, don’t use multiple values (like “Multi-Race” and “Multiracial”) to represent the same category. (Also, be sure to list all the categories for categorical data, which this data doesn’t do.) (Source: California’s COVID-19 case data by ethnicity)
(Update: This data table has been removed from the source. It seems to have been replaced with a new data table which doesn’t have this problem of multiple values.)